

2nd Quarter 2026- Asheville and Buncombe County Real Estate Market Analysis
Asheville / Buncombe County Market Analysis
The Asheville and Buncombe County housing market The Asheville and Buncombe County housing market continued shifting toward a buyer’s market in the second quarter of 2026, though conditions remain generally balanced and do not strongly favor either buyers or sellers across most price ranges. The majority of the data points to a market that is more buyer friendly than we have seen in several years. This is reflected in three key metrics. First, Average Days on Market (DOM) reached its highest second-quarter level since 2015 in both Asheville and Buncombe County. Second, inventory increased, with levels higher than in the previous four years across nearly every price range. Third, median price per square foot declined in most price ranges, another indication of a market becoming more favorable to buyers.
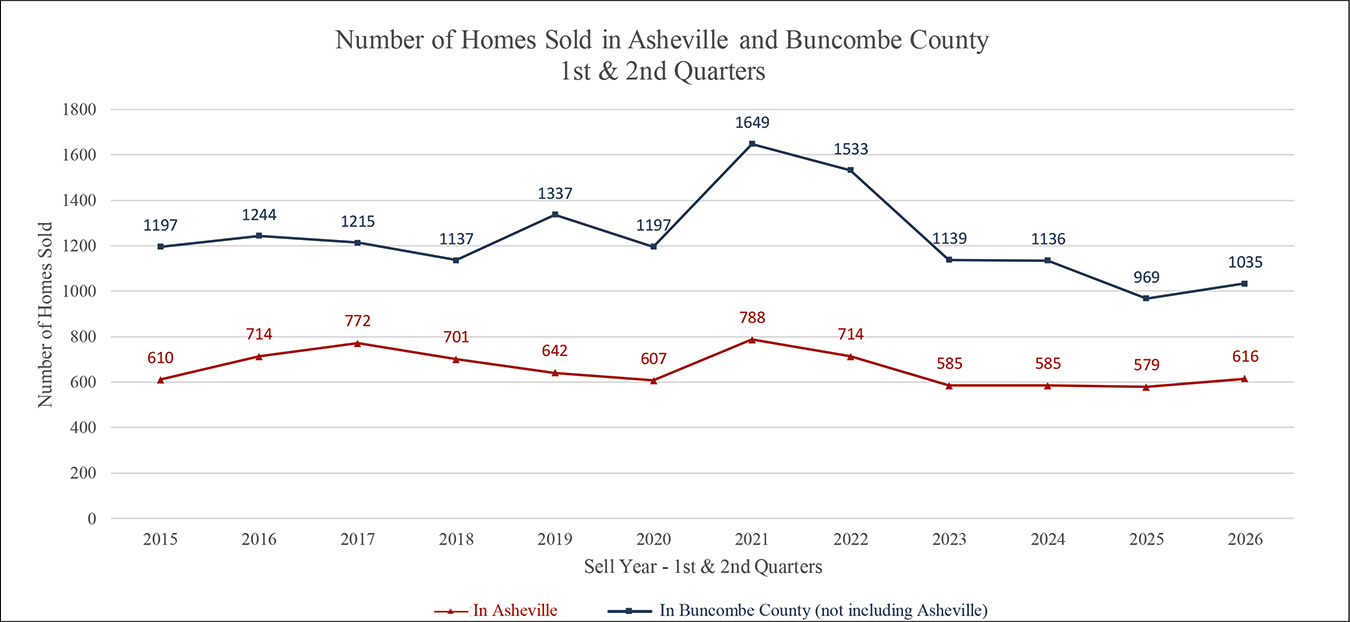
Number of homes sold In Buncombe County, the number of home sales declined from 431 in the first quarter of 2025 to 394 in the first quarter of 2026. In the City of Asheville, sales rose slightly, from 242 in the first quarter of 2025 to 255 in the first quarter of 2026 . Median home prices also edged down during this period, with Buncombe County decreasing from $450,000 to $446,000, and Asheville from $506,000 to $493,000.
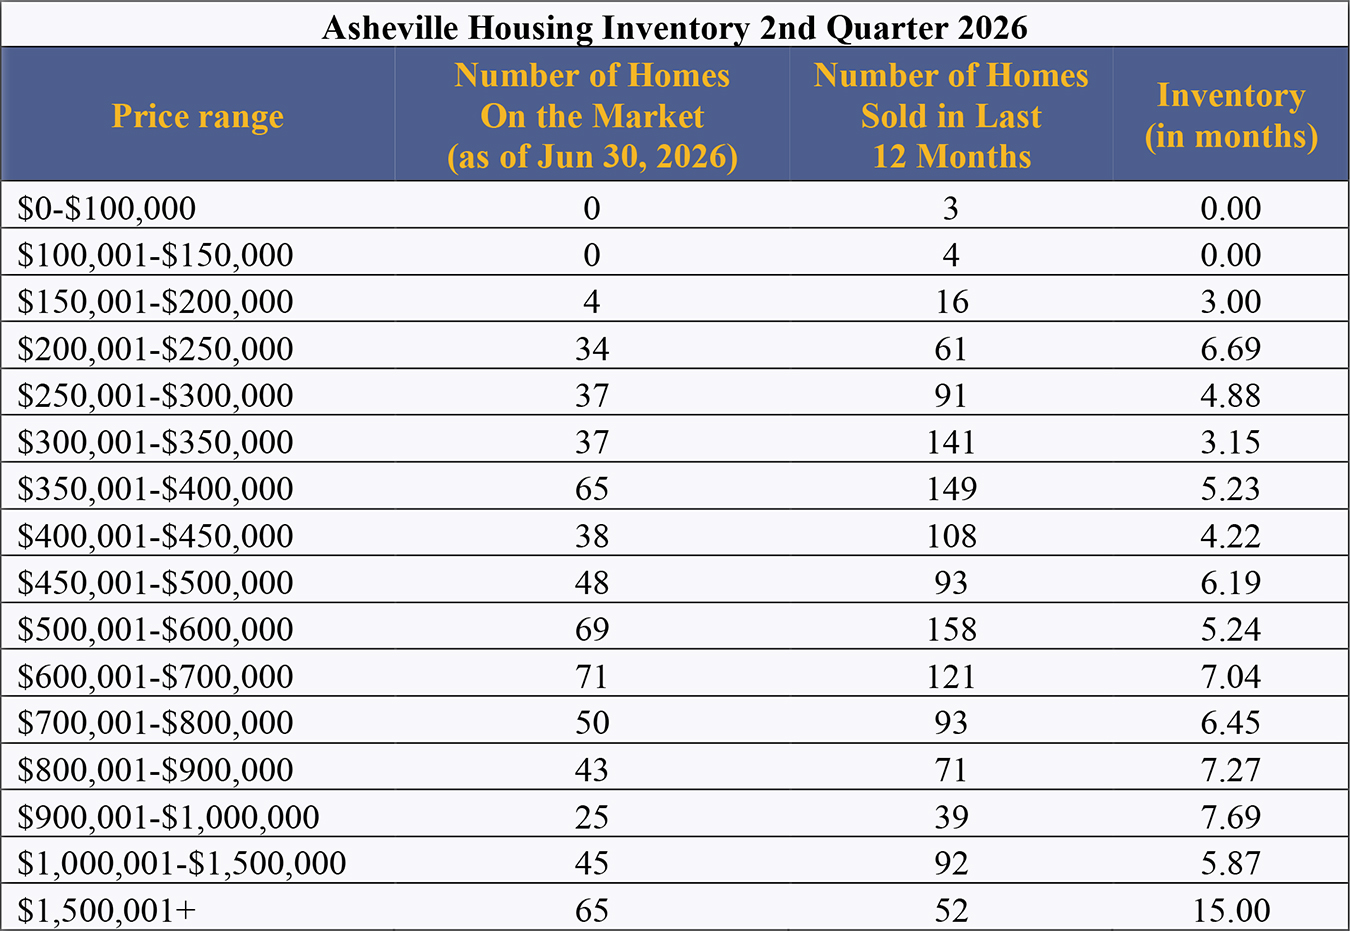
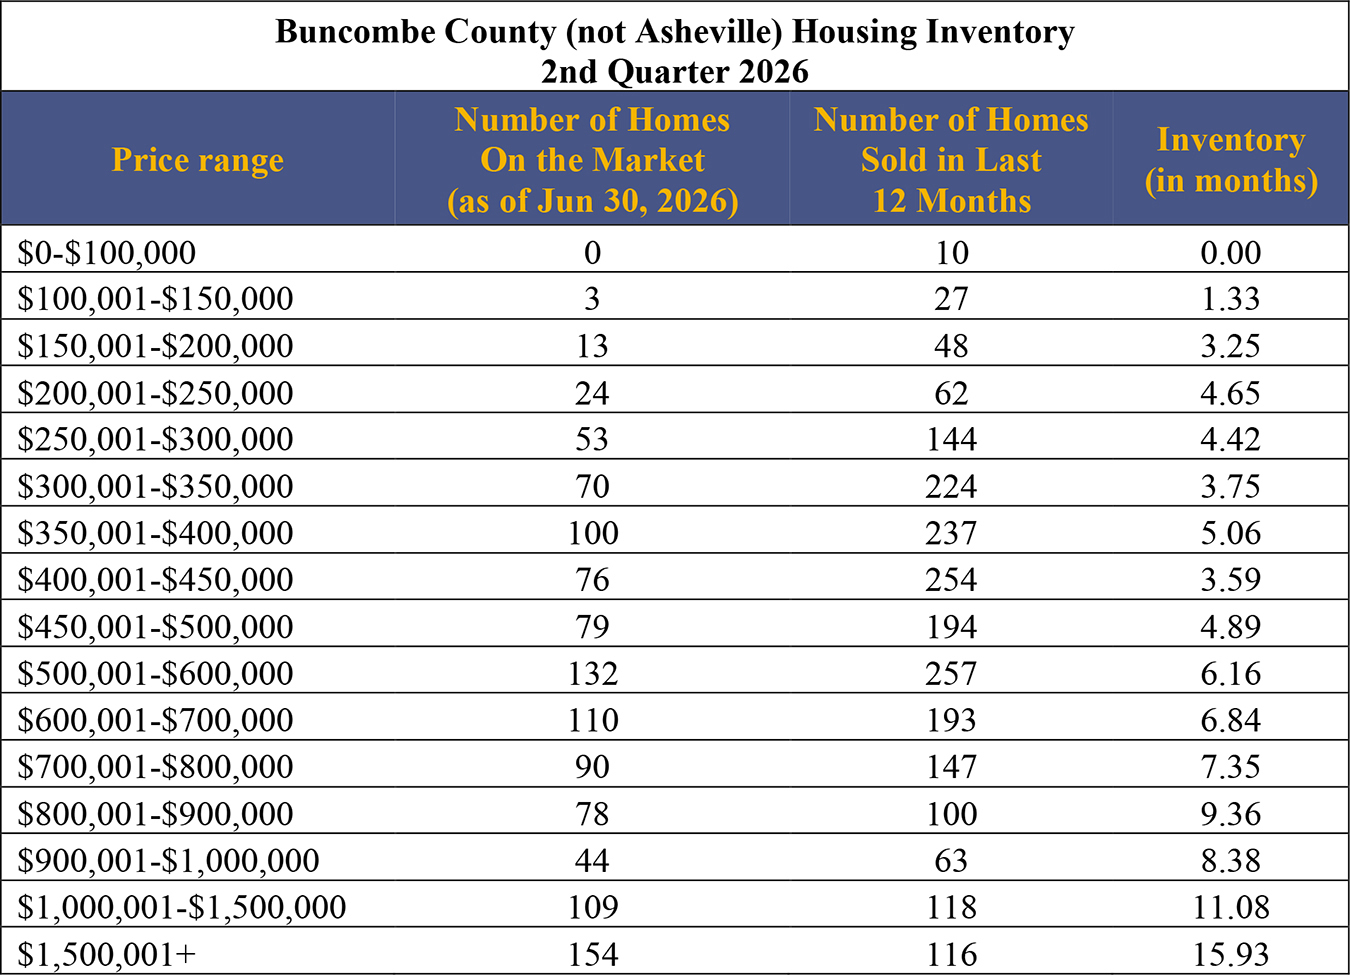
Inventory levels Inventory is the best predictor of market direction. Rising inventory indicates movement toward a buyer’s market, while declining inventory signals a shift toward a seller’s market. Inventory levels increased modestly across most price categories between the second quarters of 2025 and 2026. A balanced market is typically defined as having six months of inventory—meaning it would take six months to sell all available homes at the previous year’s sales pace. Less than six months indicates a seller’s market, while more than six months signals a buyer’s market. Although some lower- and mid-priced segments remained below six months of inventory, most categories were near that benchmark, and several higher-priced segments exceeded six months.
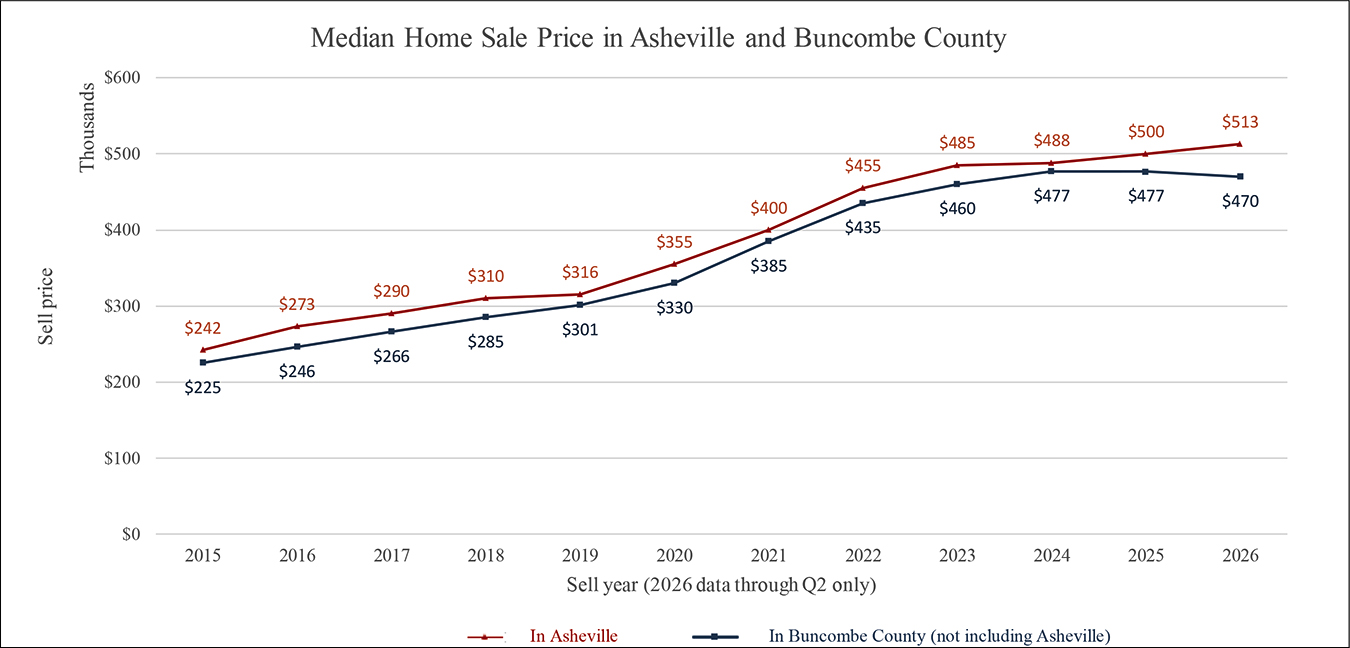
Median home sale price The median price per square foot declined in most price ranges in the second quarter of 2026.
Average Days on Market (DOM) reached its highest second-quarter level since 2015 in both Asheville and Buncombe County.
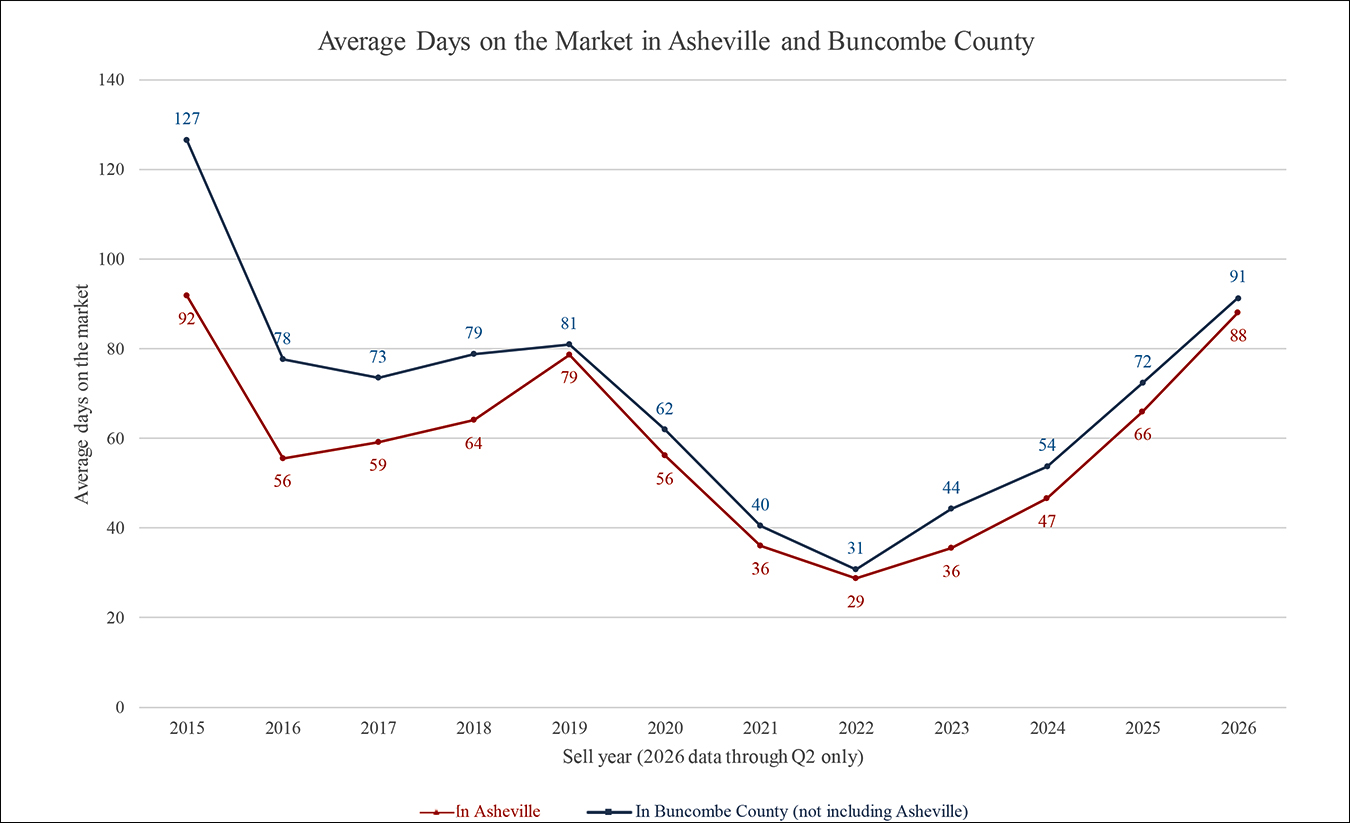
There are signs that market conditions may be reaching their most buyer friendly point and beginning to stabilize. The basic laws of supply, demand, and pricing are working in our market and evident in the data. As prices have generally declined, reflected in lower median price per square foot across most price ranges, more buyers have purchased homes. The second quarter of 2026 recorded more home sales than any quarter since the third quarter of 2024, before Tropical Storm Helene impacted Western North Carolina. At the same time, lower prices appear to be discouraging some sellers from listing their homes. After adjusting for seasonality, the number of new listings has recently slowed slightly (see Mosaic Realty’s bi-weekly market updates on Instagram and Facebook). If these trends continue, inventory should begin to decline, helping stabilize prices or place upward pressure on them.
For a complete market analysis, including Trends in Green Homes, Inventory or Price Per Square Foot,
view the entire report here. If you have any questions or would like a price evaluation of your house, please
contact one of our agents or call us at (828) 707-9556.
Be sure to contact us with any questions, as we're your local experts!
View More Market Reports




Connect